Monitor everything with Healthchecks.io
Why monitor?
Monitoring is essential for ensuring the reliability and performance of your applications. It’s like having a watchful eye on your systems, allowing you to proactively identify and address issues before they impact your users. Imagine you’re the pilot of a plane in the air, and monitoring means having a set of tools tell you things are not going right instantly. Not having the right signals could mean death.
There are various ways you can externally monitor services, at least half of the stuff I manage are private, non-public apps, services, and scripts. The best way to monitor them is using Dead man’s switch approach. It means, detecting a failure when a process gets non-operational (for whatever reason). Each service is expected to “report” that they are still functioning in an expected timeframe (you can determine what that means in your business logic).
Healthchecks.io
I use healthchecks.io, an open-source monitoring tool for this.
I monitor my servers, containers, APIs, backups, scripts, you name it. Although I use other monitoring tools for service availability; I find healthchecks.io the main and my go-to when I consider keeping an eye on a service’s operational availability.
Here is the screenshot of my checks for random things that I need to keep an eye on:
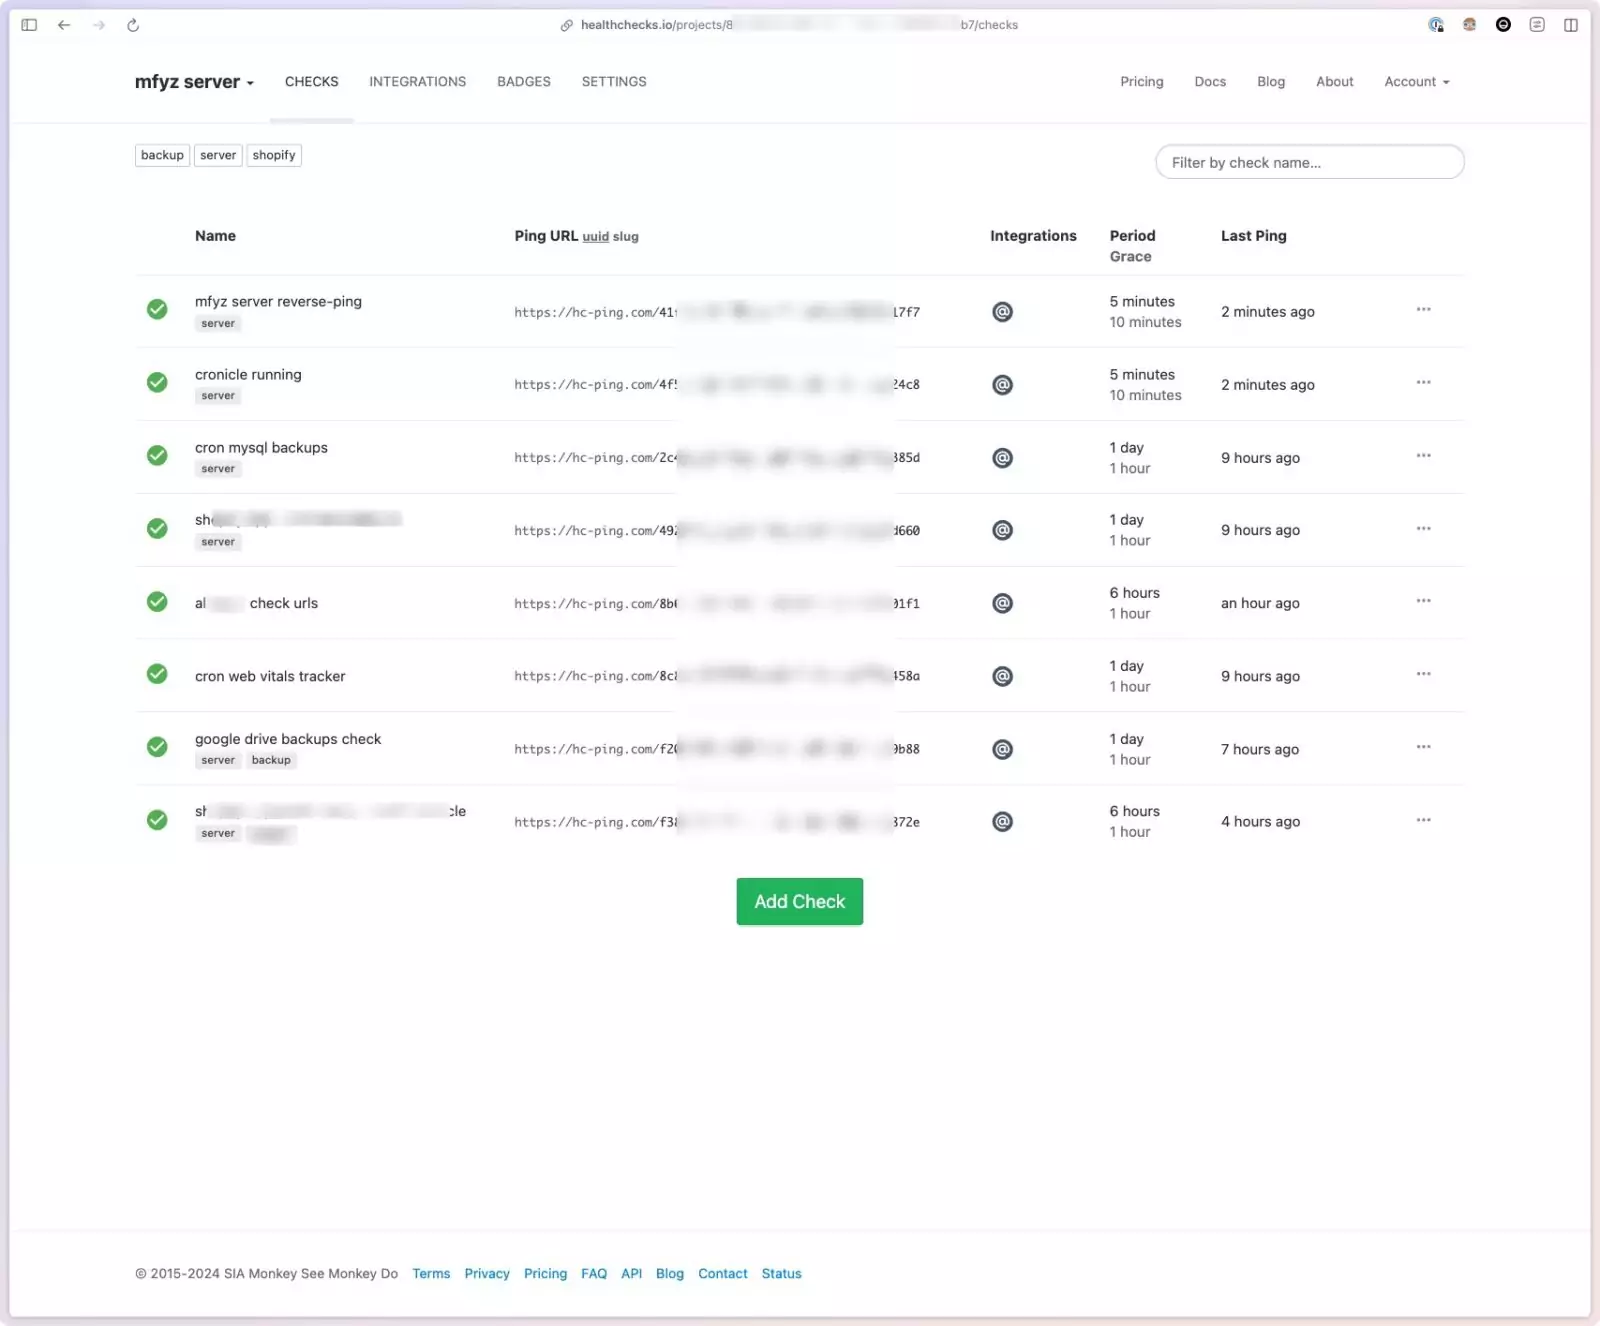
For each check, you can see the recent history of the pings, and you can see the settings.
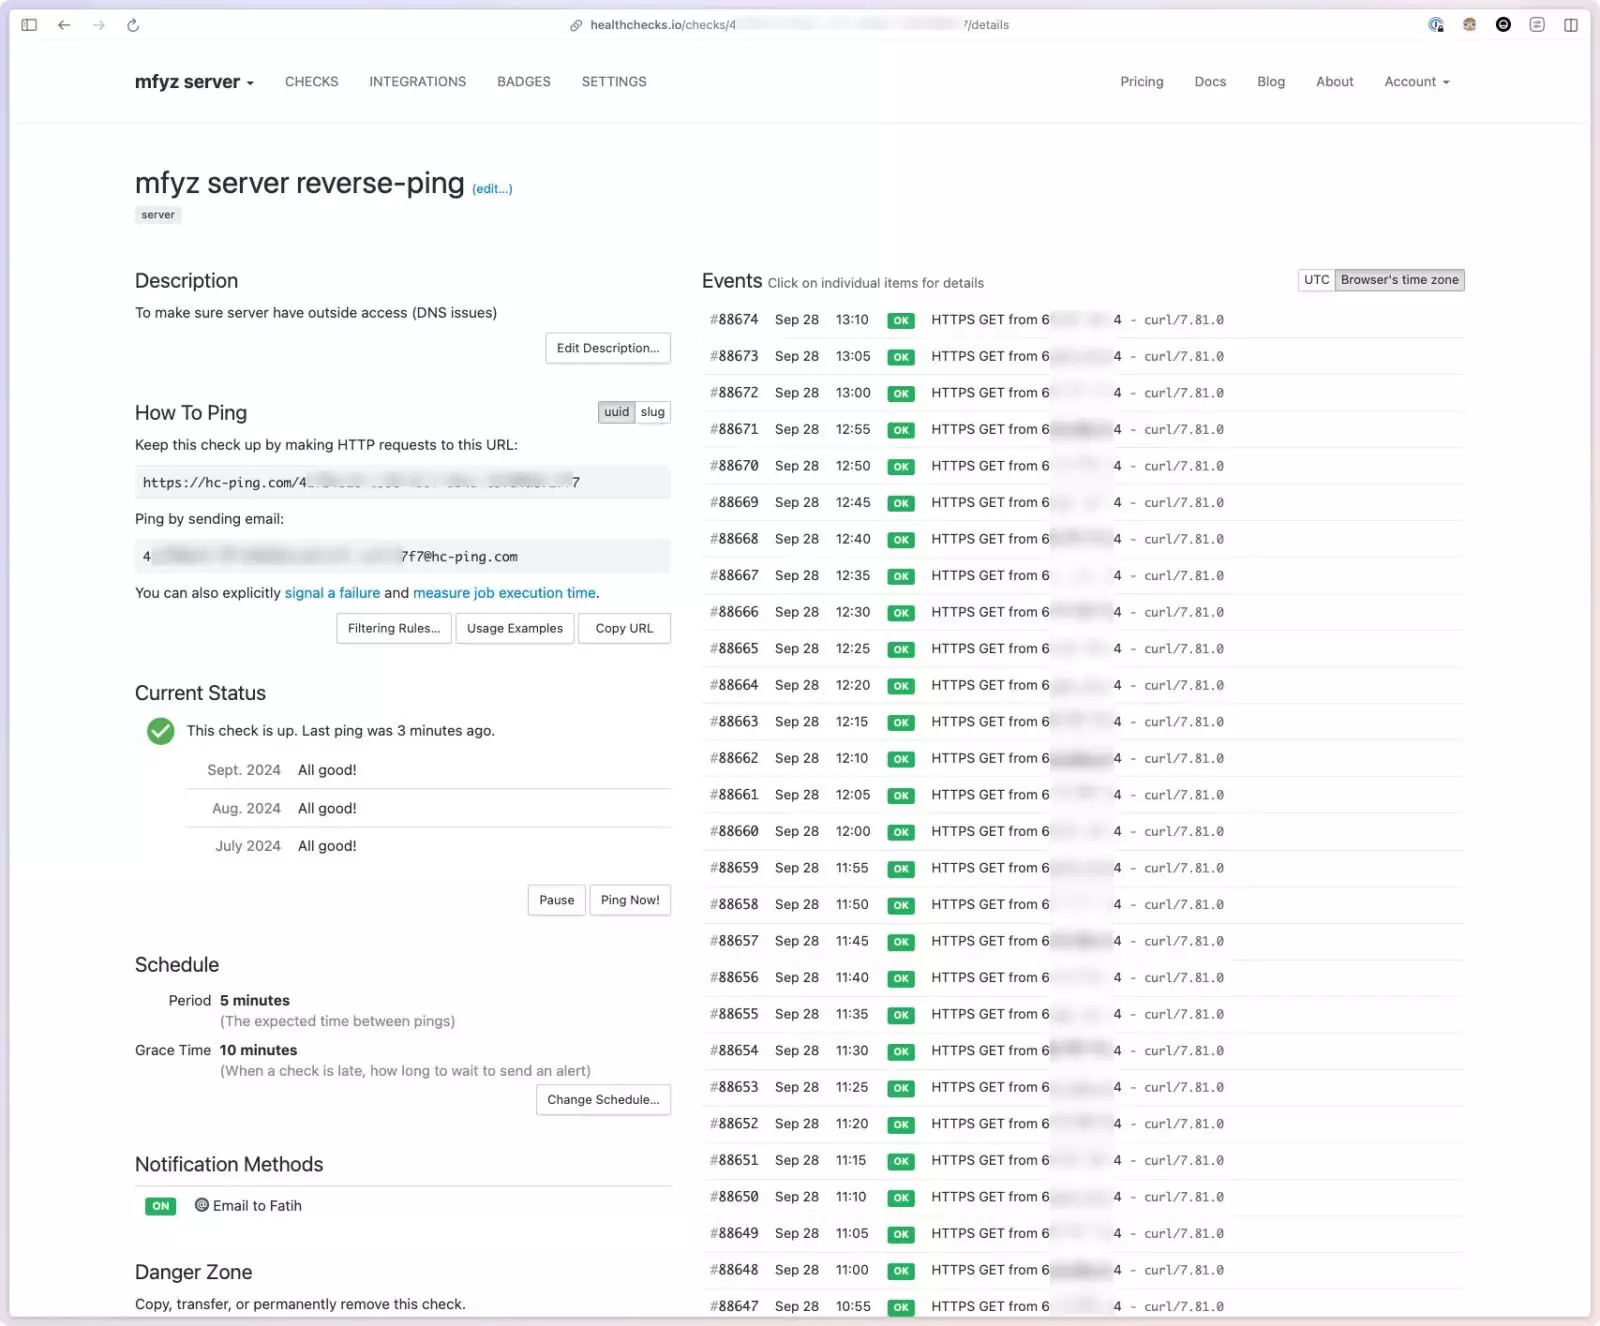
Setting up a check
You create a new “check” by pretty much only giving it a name and picking what’s the timeframe that ping is expected (from the source). You can give checks, and descriptions (I often write up where the ping is located, like, mfyz server → crontab → check-daily-backups.sh), and you can give tags, that help organize checks.
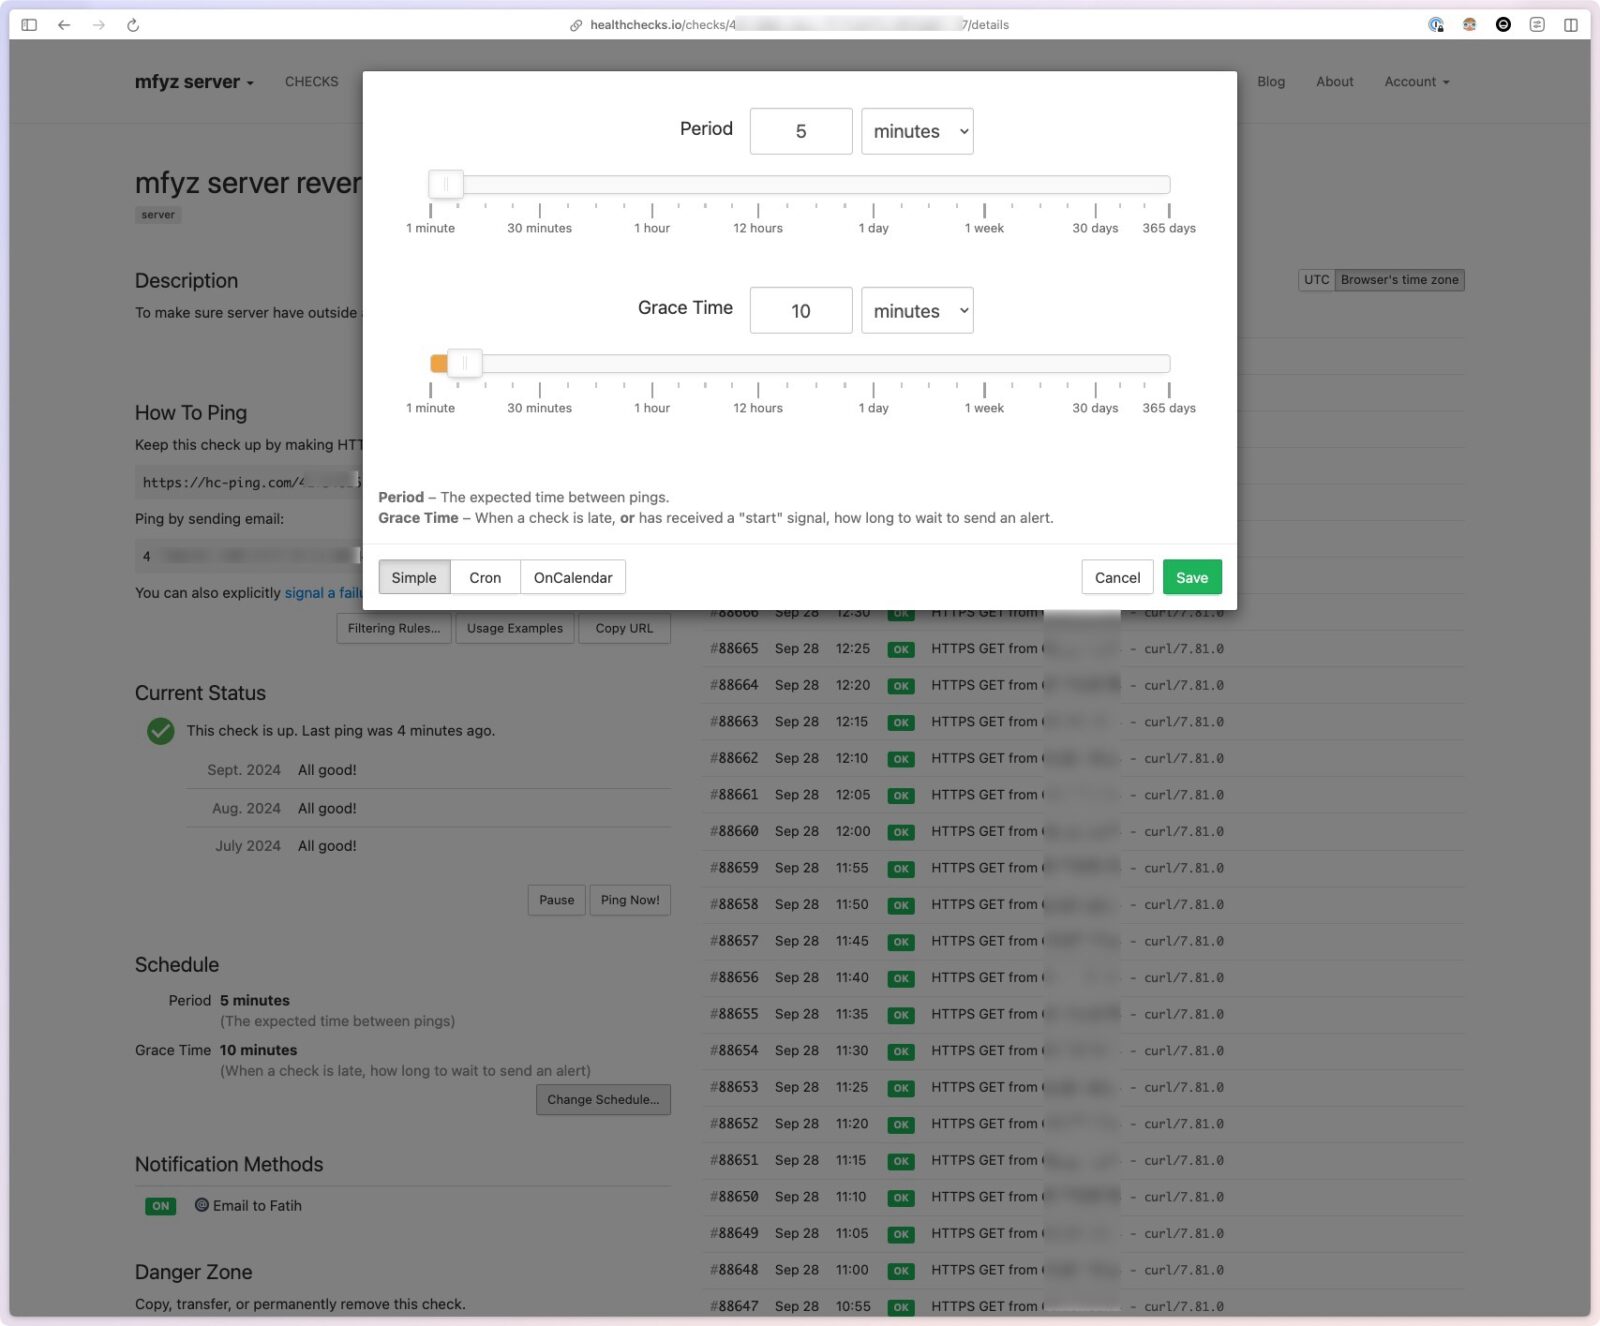
Scheduling
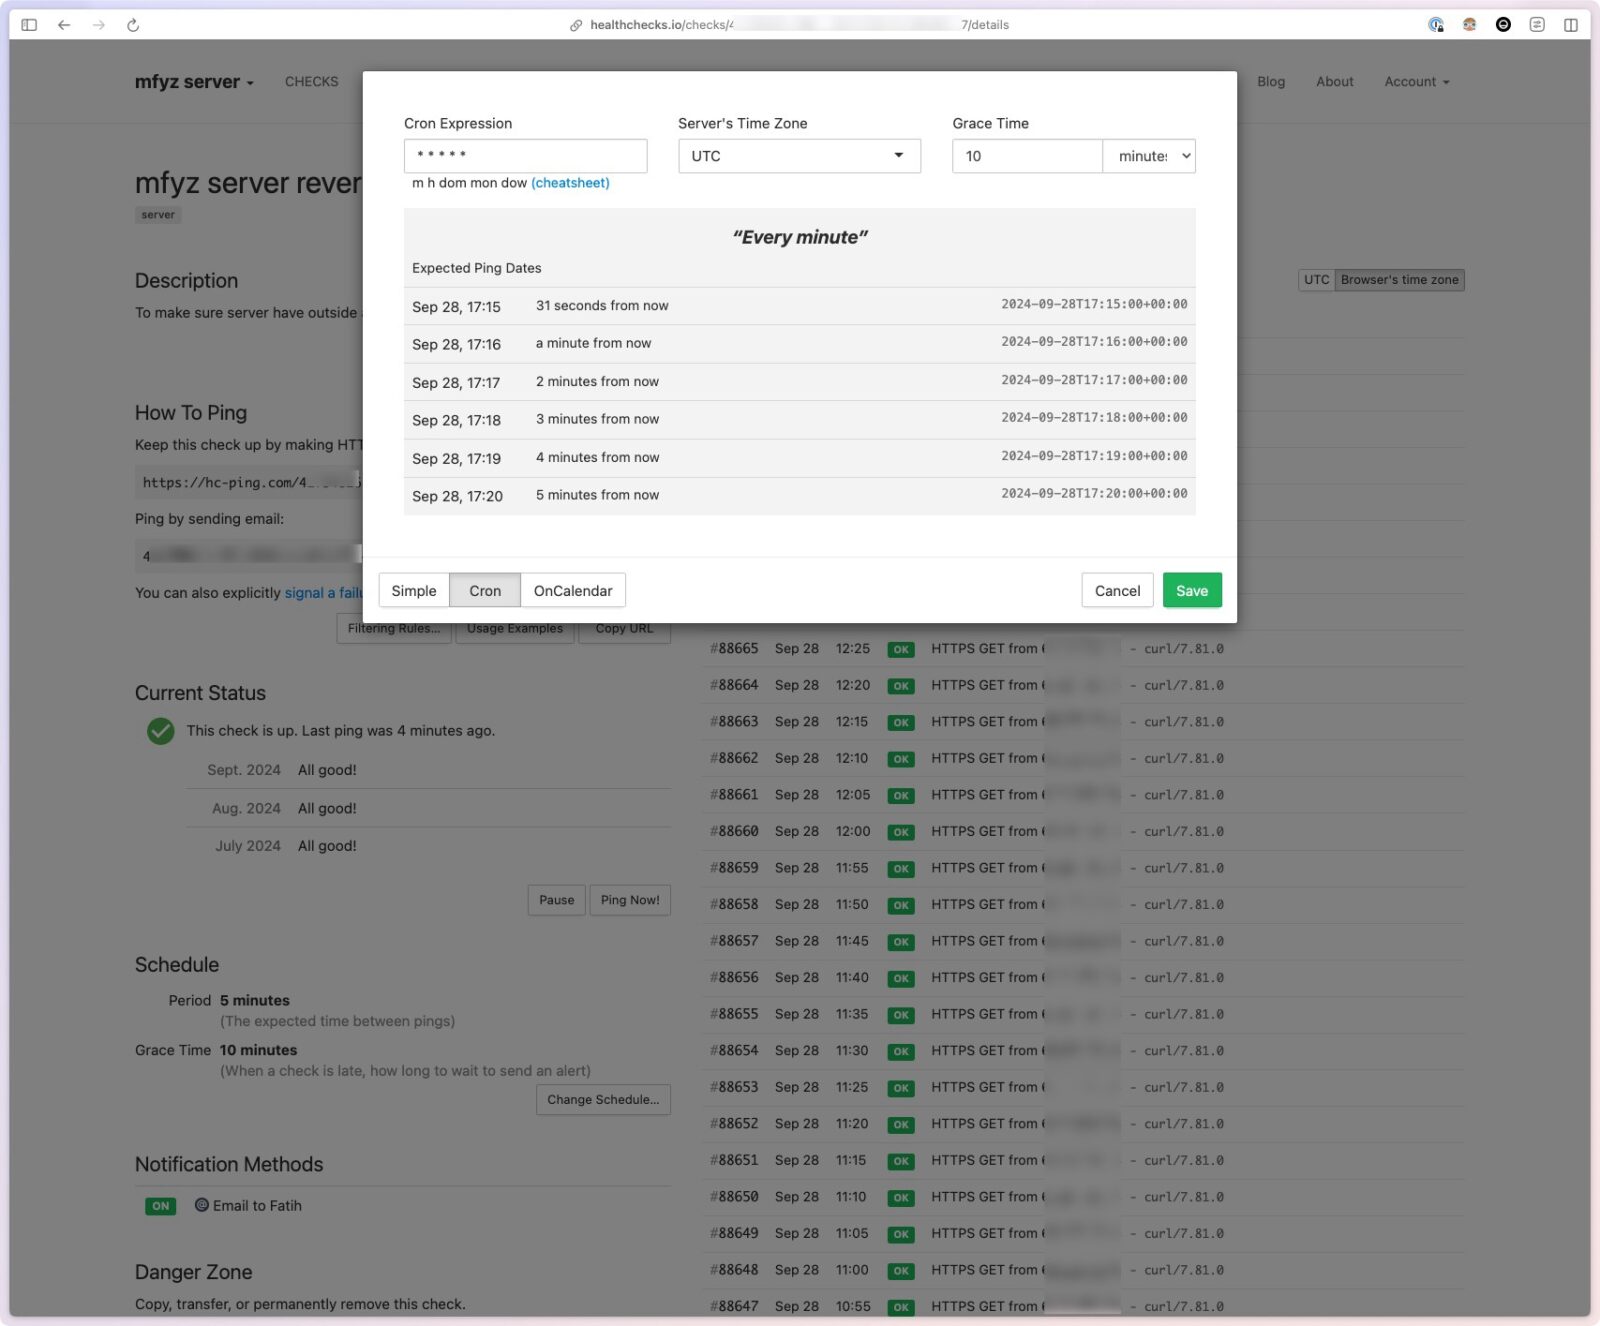
Use simple visual scheduling and grace period configuration, or enter crontab expression (which you can also generate with many online tools easily, with verbal expressions like every “Monday, 1 am”)
Preview the schedule:
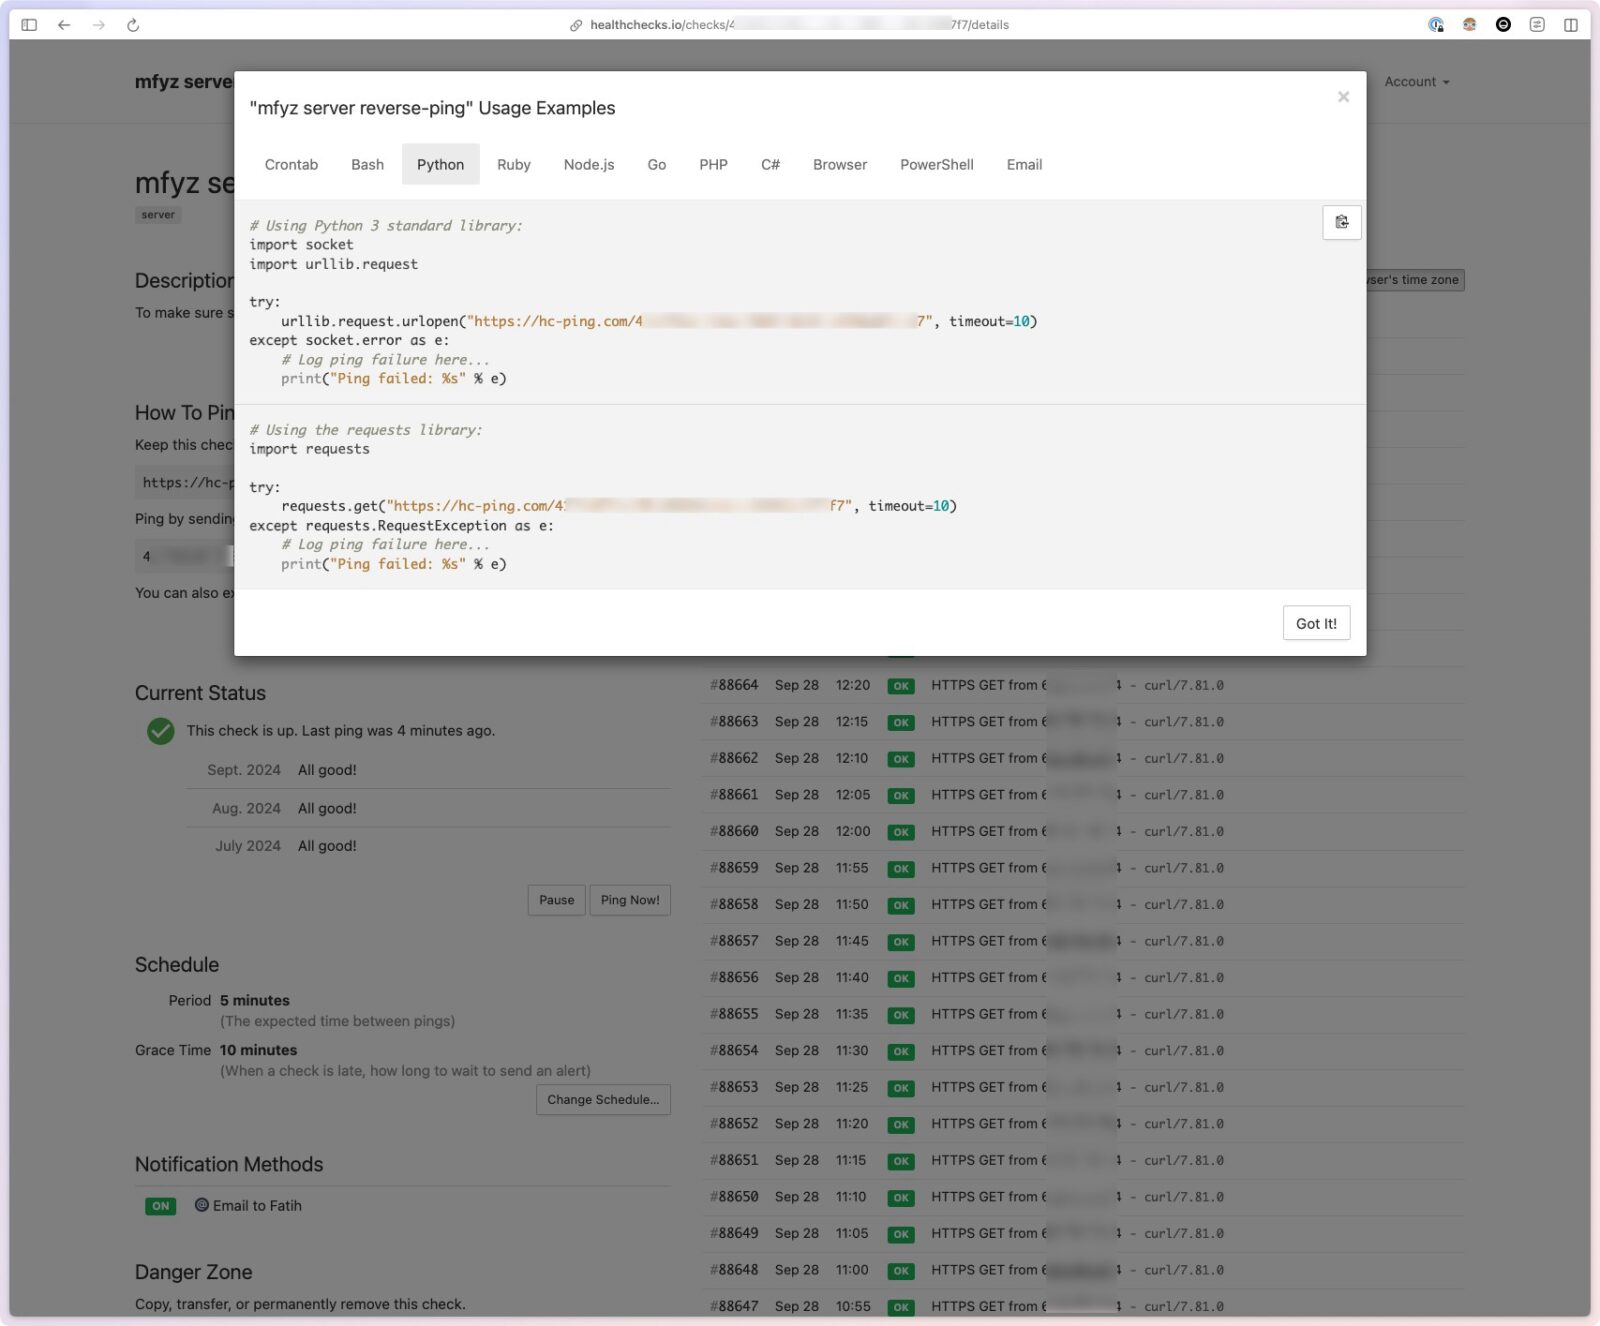
Each check essentially gets a unique long-id and you get a ping URL. It’s a simple curl/HTTP GET request to that URL that you can make in any method you want. Each ping marks the check “healthy” until healthchecks.io does NOT receive a ping within the timeframe it’s configured.
Healthcheck.io also gives copy/paste snippets for various languages on the check detail page:
Integrations and Extensibility
I love healthchecks.io because it’s a very simple tool, that does not have 50 screens or settings, but well designed/thought service that provides rich ways to configure, and interact with it. A few points I find it really useful:
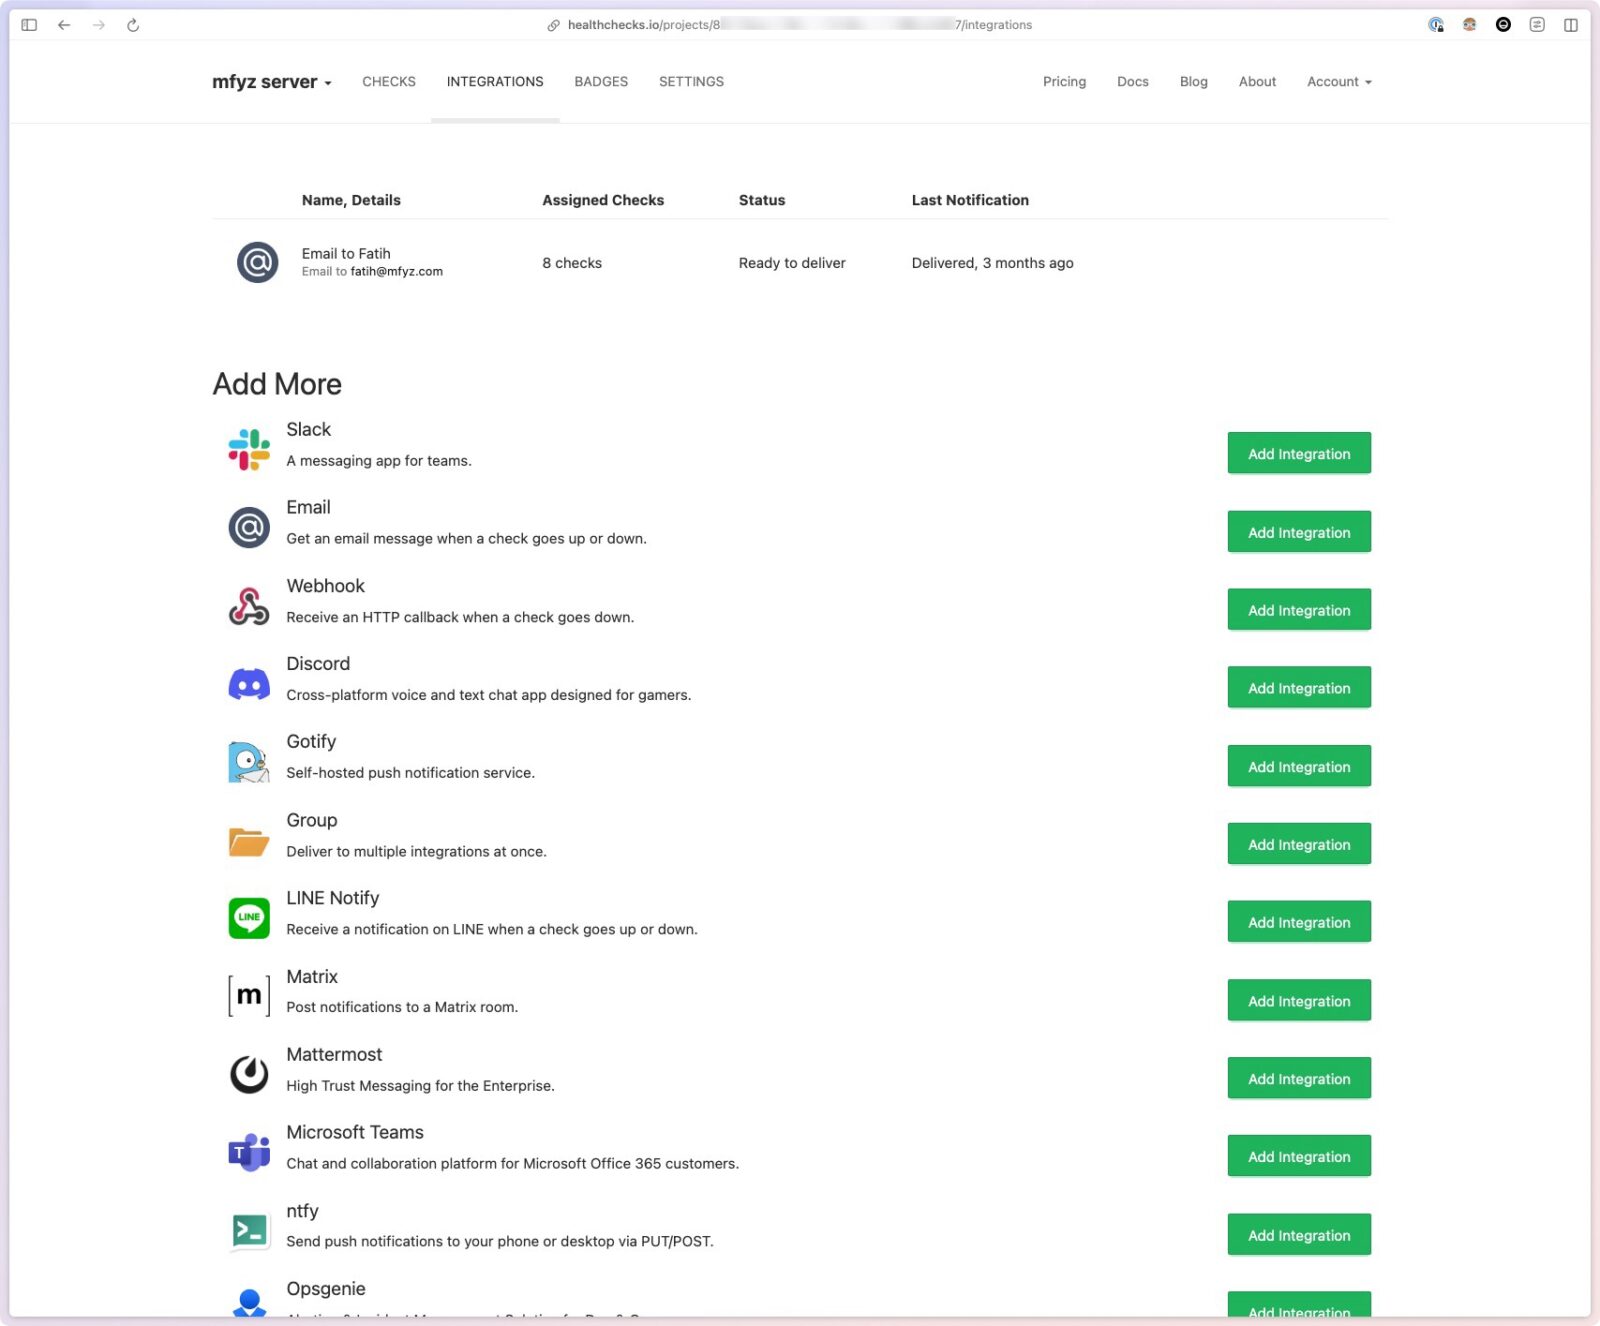
Integrations with almost anything I need
Integrations are mostly notification channels, but most are just a few clicks configuration.
REST Management API
Pretty much any object and any action you do in the UI can be done via their rest API.
https://healthchecks.io/docs/api
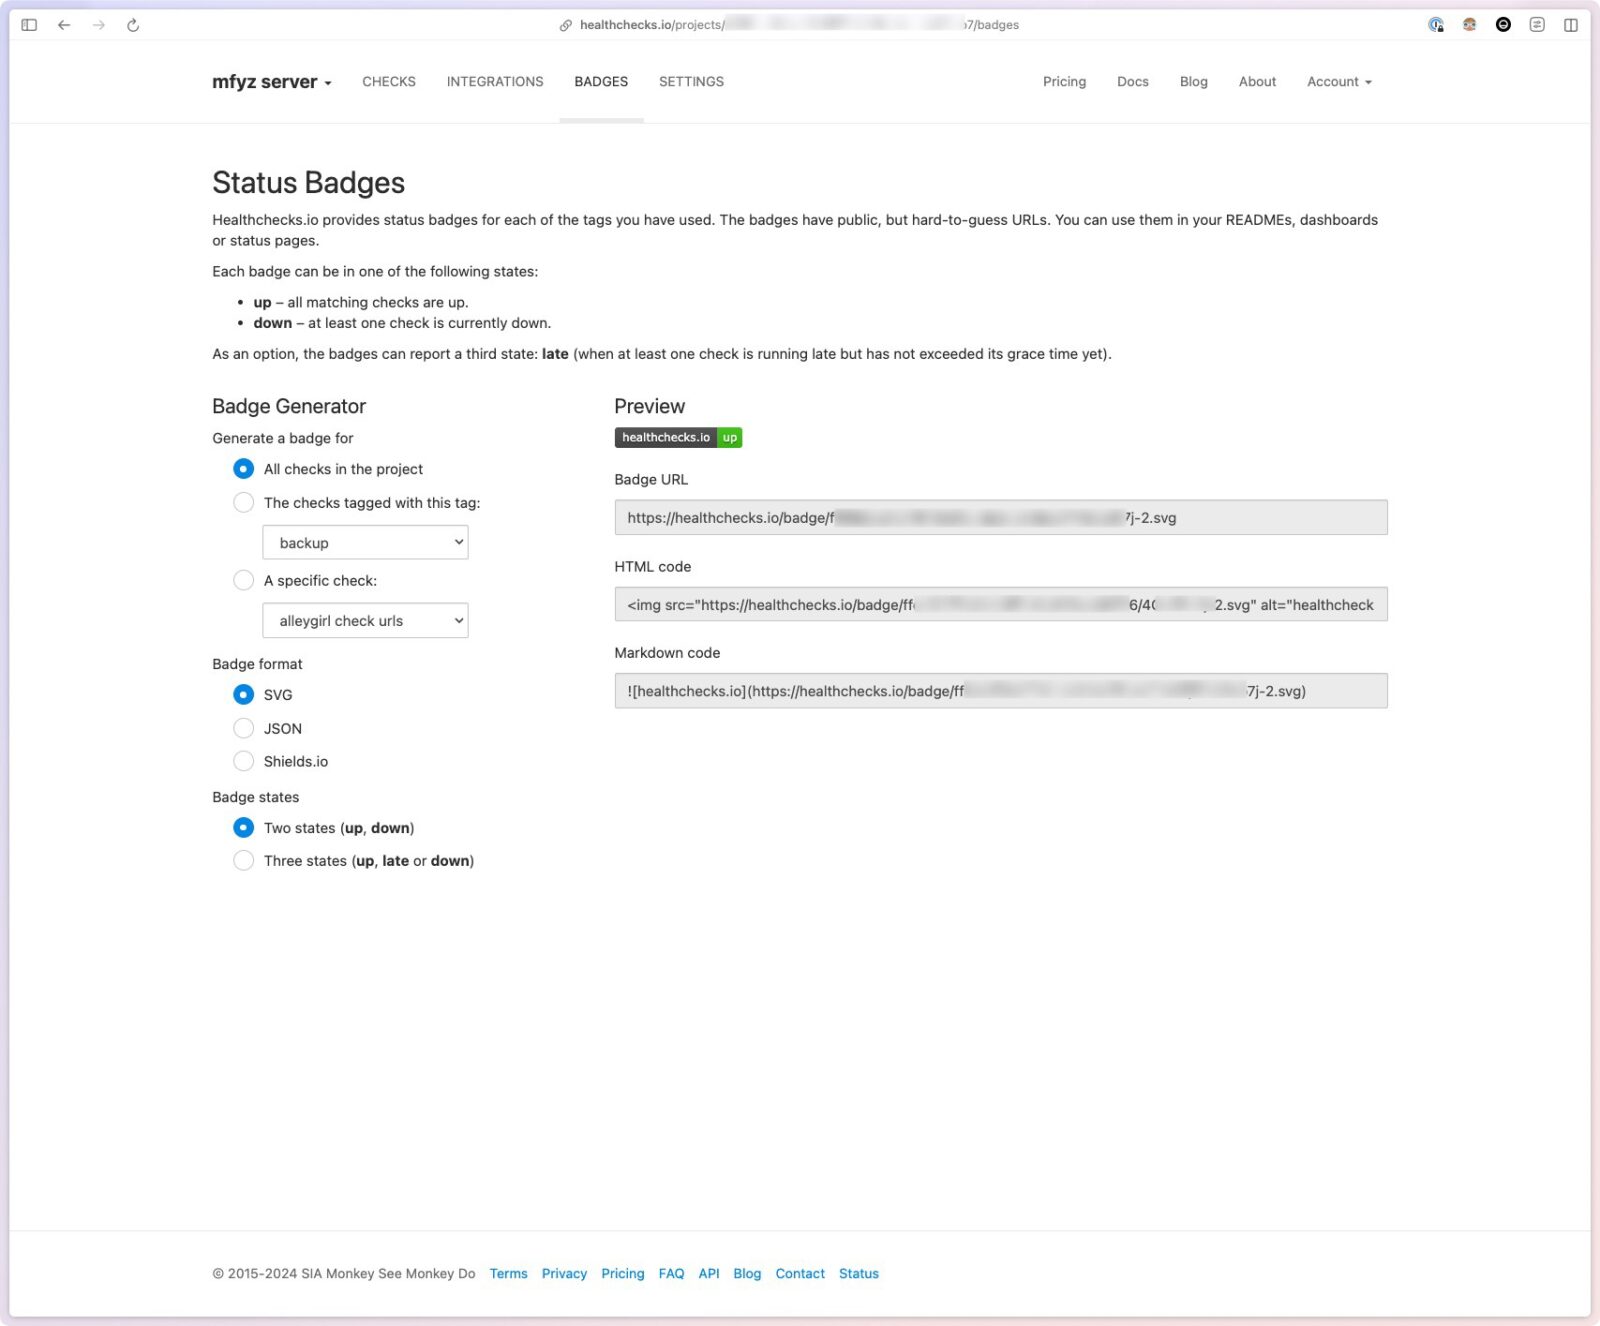
Badges
To slap status badges easily in random places (dashboards and such):
Self-hosted vs Cloud/SaaS Healthchecks.io
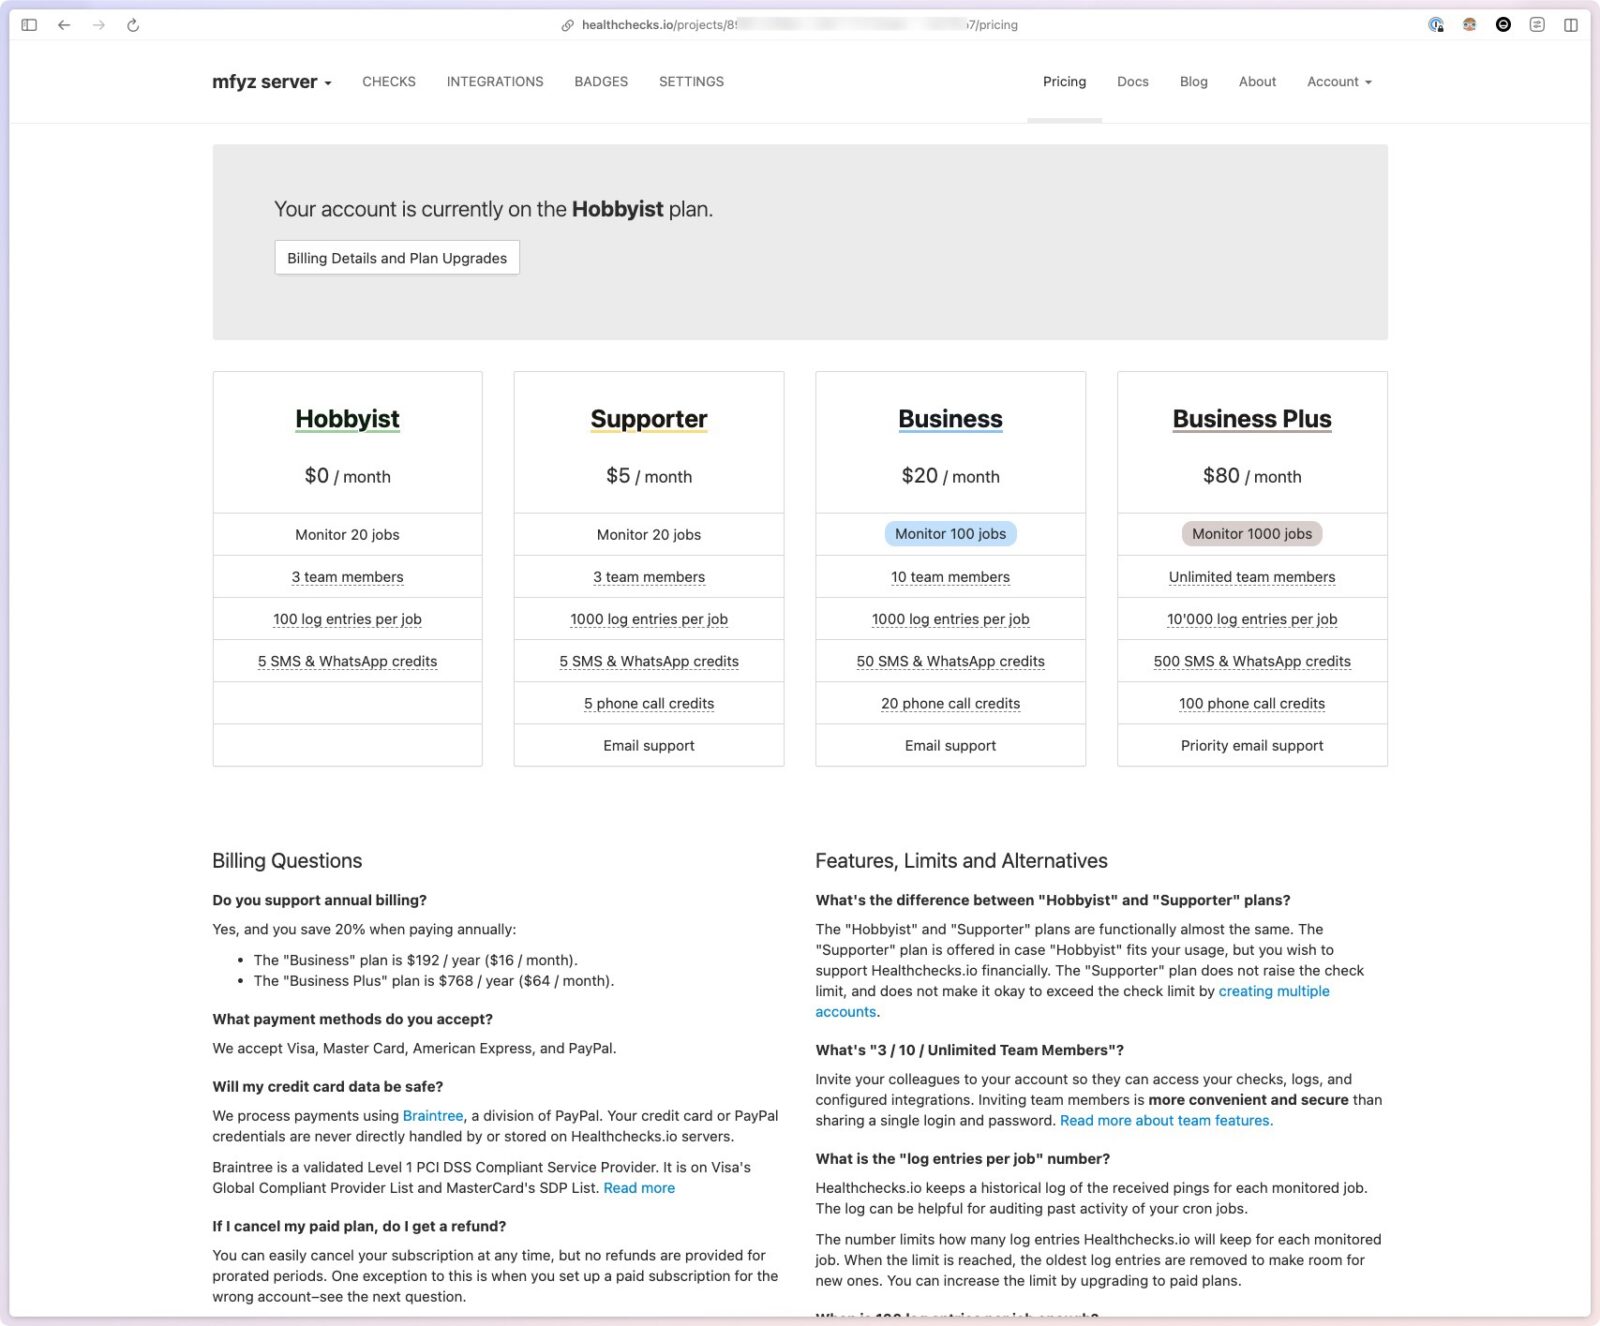
Healthchecks.io is an open-source tool. You can host your own instance easily using its docker-compose.yml file. They also have a cloud/SaaS version with a fair free/hobby plan that should be more than enough to track your microservices, servers, cron jobs, etc for your small/side projects. I use their cloud version but I can move to my own self-hosted version any time I want.
In the case I grow my use of healthchecks, I find their pricing plans really reasonable and I’d most likely stick with their cloud version and would be happy to pay:
I’ll suggest an alternative below, but before that, I want to say, that even though there are richer and more powerful services, I prefer to keep my monitoring separated and have more control over them. Example: I do have an end-to-end script that browses a few pages and checks stuff using playwright, and I try to keep it experiment plain/simple on purpose. And simply have a bash script that runs the playwright test and pings a check in healthchecks.io when it passes. That monitor is simple enough that I can move to any other service, or move the test from where it runs to another place without worrying about any vendor lock. Instead, I would have used a service like Checkly but it would lock me in right away. In short, I like how healthchecks.io contributes to this decoupled model and plays a central reporting engine for my monitors.
Best next alternative: Uptime Kuma
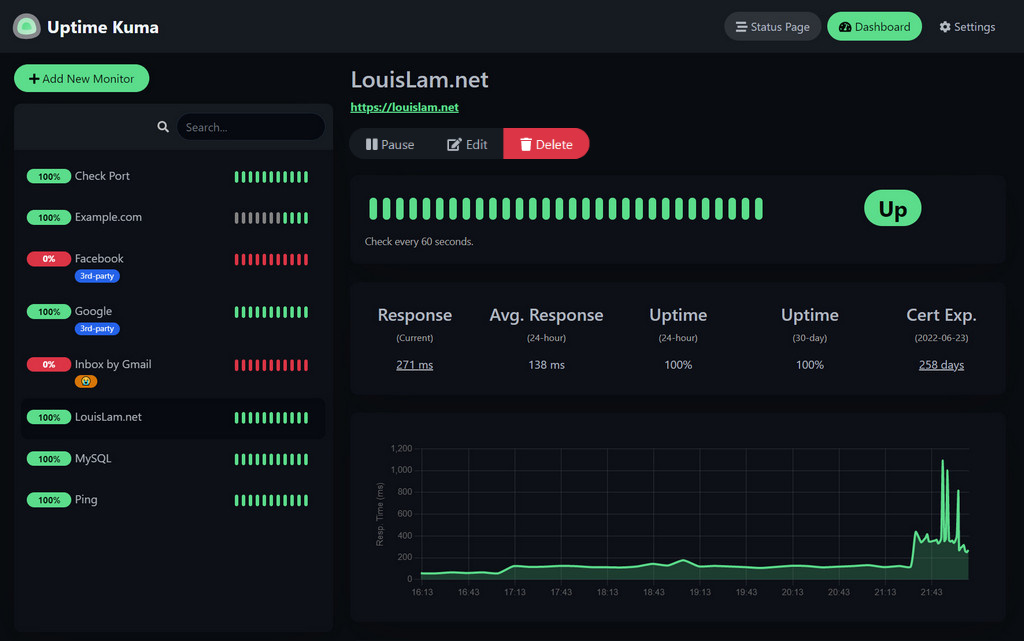
If you want a more robust monitoring tool that has more ways to monitor your services, and websites, beyond the dead man’s switch method, check out uptime kuma.
It has almost all the features healthchecks.io has, plus a few more:
Status pages
More check methods like DNS record, ping, docker container, SSL cert
Its Web UI looks more traditional monitoring tools like uptime history, response time, etc
Run via Docker:
docker run -d --restart=always -p 3001:3001 -v uptime-kuma:/app/data --name uptime-kuma louislam/uptime-kuma:1
Check out the project page: https://github.com/louislam/uptime-kuma
This article was originally posted on my blog: https://mfyz.com/monitor-everything-with-healthchecks-io/